
Transimpedance Noise: Bode Plot vs Exact Noise
July 03, 2012
This note compares the transimpedance voltage noise results for the op-amp voltage noise en obtained using a segmented bode plot analysis with the exact results.
The segmented Bode plot analysis, such as that described in Photodiode Amplifiers, J. Graeme, 1996, McGraw Hill p.94, provides a useful and intuitive analysis of the various
sections of the noise-gain curve in frequency. That type of analysis facilitates addressing noise reduction scenarios as are discussed in detail in that book.
The purpose of this note is to comment on the typical accuracy of the segmented analysis.
Sample Circuit:
 To be specific, a typical transimpedance amplifier is analyzed. The circuit could represent a basic photodiode transimpedance amplifier with
the photodiode modelled as a current source Is and a fairly low shunt capacitance and high dynamic resistance. With the component values shown, the transimpedance response is reasonably
well damped with Q ~ 0.6 and a transimpedance f3db = 3.10 MHz. The op-amp is modelled as ideal, except for a finite GBW=65MHz described
by a single-pole open-loop rolloff model. The op-amp voltage noise spectral density en is 7nV/√Hz.
The feedback network is as shown with the values indicated. Ci is the total of photodiode, op-amp input and stray capacitances. Cf is the total feedback capacitance.
Ri is very high translating into a low frequency gain of 0dB:
To be specific, a typical transimpedance amplifier is analyzed. The circuit could represent a basic photodiode transimpedance amplifier with
the photodiode modelled as a current source Is and a fairly low shunt capacitance and high dynamic resistance. With the component values shown, the transimpedance response is reasonably
well damped with Q ~ 0.6 and a transimpedance f3db = 3.10 MHz. The op-amp is modelled as ideal, except for a finite GBW=65MHz described
by a single-pole open-loop rolloff model. The op-amp voltage noise spectral density en is 7nV/√Hz.
The feedback network is as shown with the values indicated. Ci is the total of photodiode, op-amp input and stray capacitances. Cf is the total feedback capacitance.
Ri is very high translating into a low frequency gain of 0dB:
The gain plot below shows the segmented Bode plot (in black) and identifies the numbered regions as discussed in Graeme's book. Region 1 (the 1/f noise region) is not included since
a constant en is assumed here. Therefore region 2 extends to DC. The relevant frequencies, fz, fp and fi which identify
the boundaries of the Bode segmented noise analysis regions are shown. fi= GBW/[(Cf+Ci)/Cf] is the intersection of the high frequency asymptotic noise gain (Cf+Ci)/Cf with the open-loop gain curve.
The yellow curve shows the true noise-gain profile (which includes the finite GBW product rolloff of the op-amp).
The usual "noise gain" profile is shown in magenta and is actually the magnitude of 1/β(f) where β is the complex feedback fraction of the Ri, Ci, Rf, Cf network.

Comparison of Results:
The Bode noise analysis method consists of approximating the true noise-gain curve with the approximate segmented curve shown. The amplified output voltage noise originating from en is calculated by integrating
the amplified noise power density over frequency:
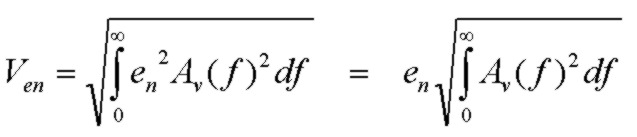
Av(f) is the gain magnitude which is the true noise-gain or the Bode gain approximation.
The Bode analysis calculates each segment separately. The error in the Bode analysis is the difference in area between the true noise-gain and Bode profiles. The segmented
analysis, for this type of noise-gain peaking profile characteristic of transimpedance circuits, tends to overestimate the total noise in the high-gain sections (upper part of 3, 4, 5) as can be seen in the graph.
Section 2 and the lower part of section 3 are underestimated but since these are small gain regions encompassing small frequency ranges (note the log-log scale), the overall total is overestimated.
Region 5 extends from fi to infinity. (Beyond fc, the op-amp unity-gain frequency, higher order poles will occur but the gain will be low very low beyond that point compared to the
noise contribution in the peaking regions of typical circuits.)
The calculated noise-values in µV units for each segment and the exact calculated values for these segments and the totals are shown below to demonstrate this:
 Section:       2             3          4         5          Total

 Bode:         3.4          61.3        142       177          235

 Exact:        3.9          55.6        130       167          219
The Bode analysis overestimate is ~ 7% which is acceptable accuracy in many cases.
A very simple expression , based on a first-order approximation of the exact total noise voltage for en provides surprising accuracy:
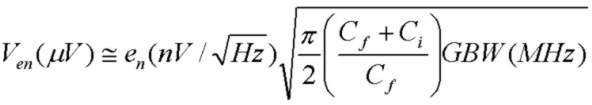
This approximation, which applies even for values of Ri comparable to Rf, yields a value of the 222.4 µV which is within 2% of the exact total output voltage noise.
The total voltage noise due to en can threrefore be equivalently viewed as the noise en amplified with UNITY GAIN over the entire spectrum up to a high effective
noise bandwidth of π/2*fh where fh=(Cf+Ci)/Cf*GBW.
The output noise expression above can also be written in an equivalent form:
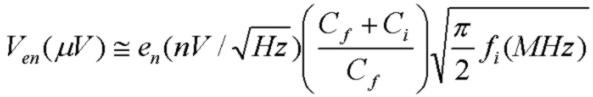
where fi is the intersection frequency noted above. This alternate expression shows that the total voltage noise due to en can also be equivalently viewed as the noise en amplified
with a contstant and uniform noise gain of (Cf+Ci)/Cf, the high frequency asymptotic noise gain, up to a noise bandwidth of π/2*fi.
The spectral output noise density for the exact noise-gain curve and the two equivalent approximations above which give almost exactly the same total integrated output noise are displayed:

It should be noted that these approximate expressions are only relevant for calculating the total noise over all frequency. If the output noise spectrum is additionally post-filtered , the true noise-gain
profile must be used for noise integration purposes.