
Measuring Pickup Impedance with Digilent Analog Discovery
Aug 28, 2013

This note describes using the Analog Discovery
design kit along with the Waveforms software to measure the impedance of a typical electric guitar pickup. Electric guitar pickups are inductive transducers characterized
by high inductance Lp (typically 3 - 5 Henries), fairly high DC resistance Rp ( several kΩ) and fairly high shunt capacitance Cp (100+ pF). This leads to a resonant response peak usually in
the low kHz audio region which contributes partially to the characteristic sound of a given pickup. The schematic diagram on the right shows a simplified
equivalent circuit of a pickup in a circuit along with a series resistor Rs using to measure the complex impedance (amplitude and phase) of the pickup.
The Pickup:
A Seymour Duncan SH-1b bridge pickup, a design duplicate of the classic '59 Humbucking pickup was tested. This type of pickup is representative of many pickups found in modern electric guitars.
Test Setup:
A simple series circuit is used for determining the pickup impedance. Since the pickup impedance is high, particularly at the resonant frequency, a moderately high value of Rs=10kΩ
is used to provide sufficient voltage across Rs for determining the current. In the frequency domain, the complex impedance of the pickup at frequency f is the ratio of the voltage phasor across the pickup divided by the current phasor through
the pickup at frequency f. Since the impedance is a ratio of two phasors, it is a type of "transfer function". Therefore a Bode plot which measures a phasor ratio of an output voltage relative to an input voltage can be used to
determine the pickup impedance (including a constant factor of the Rs series resistance to convert the voltage across Rs to a current).
To measure the complex impedance, the voltage amplitude/phase across the pickup and the current amplitude/phase through the pickup must be measured as the frequency is scanned.
The Network Analyzer tool of the Waveforms software provides this capability. It is possible to determine the complex impedance using a single Bode plot scan by connecting Channel 1 (C1) across
the series resistor Rs and Channel 2 (C2) across the pickup. The resultant normalized "gain" displayed by C2 is then, after multiplying by the resistance value Rs, the transimpedance amplitude.
(Unfortunately v2.1.3 of the Waveforms software only allows display of the Bode plot in dB units; however data exported to a .csv file can be chosen in "gain" units).
The transimpedance phase is the Bode plot phase (since the Bode plot is C2 relative to C1). The problem with this approach is that the scope probes across C2 tend to "load" the circuit
(see discussion below) resulting in a greater current draw and a lower measured impedance.
Obtaining a more accurate measurement of complex impedance requires two separate measurements, with different connections, for the voltage across the pickup and the current
through the pickup (as measured by the voltage across Rs). In both measurements, C1 is
the reference signal and measures the Waveform Generator voltage of W1. The pickup impedance can be correctly obtained
since both voltage measurements are normalized relative to the same C1 voltage measurement. The overall setup is shown below:
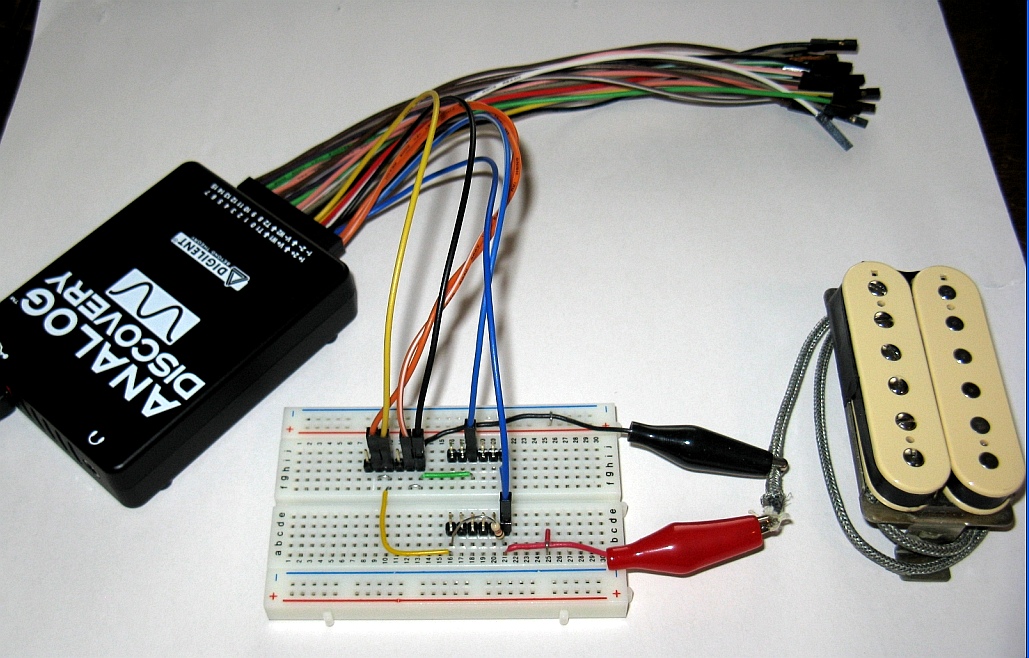
Voltage and Current Measurements:
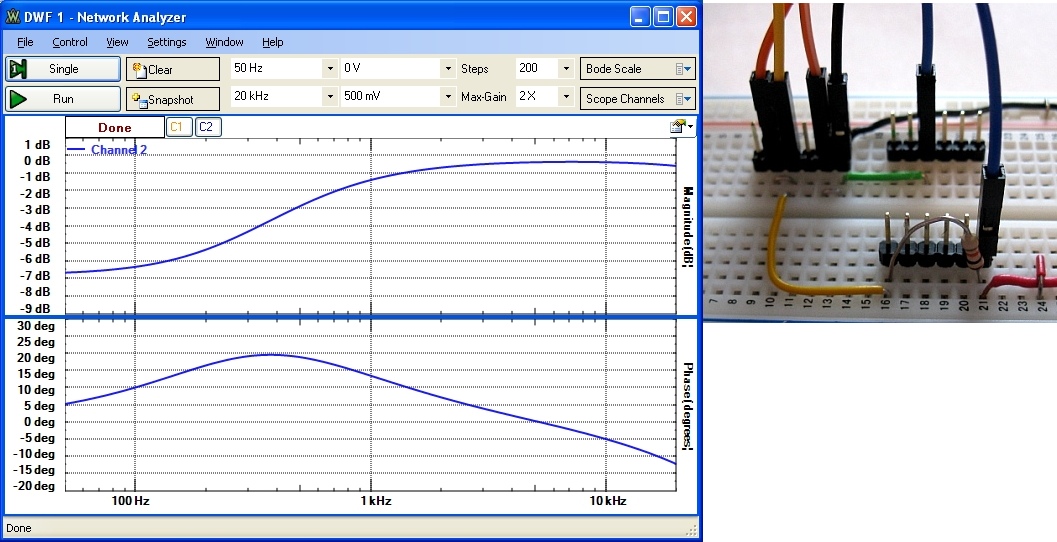
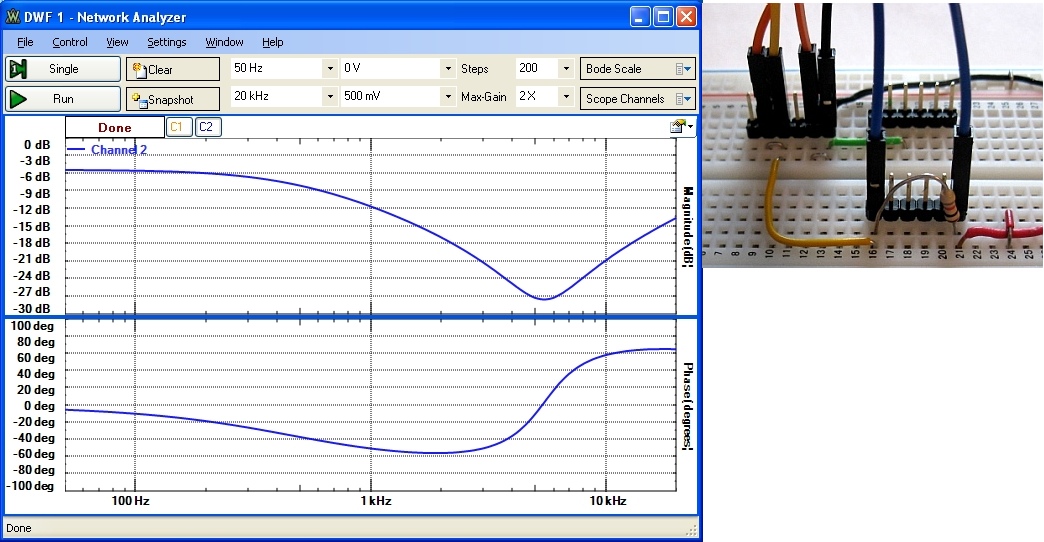
The voltage and current measurement results, along with the wiring configurations on a small protoboard using the Discovery 6-pin headers are shown below. Scope C1 (1+ and 1- ) and WaveForm Generator (W1 and Gnd) are connected at the circuit input.
C2 pins (2+ and 2-) are connected across the pickup terminals for the voltage measurement, and across the series 10kΩ series resistor for the current measurement (with 2+ connected at the W1
side). This configuration is possible since the scope channel inputs are fully differential and are isolated from the Discovery Gnd connection:
The DC resistance of the pickup was measured to be Rp=8.5kΩ using a multimeter.
Impedance Calculation:
The complex impedance Zp is the ratio of the pickup voltage phasor divided by the pickup current phasor. It is complex and consists of an amplitude |Zp|
and phase angle θZp.
The current in the pickup is VRs, the voltage measured across Rs, divided by the value of Rs. Mathematically, the impedance is related to the measured parameters above as:
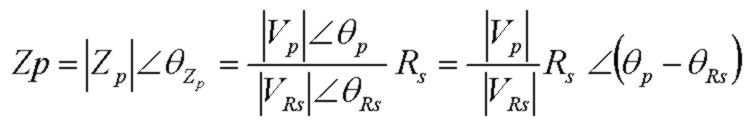
Since both voltage measurements in the configuration above are relative to the same input voltage, the phase angle is the DIFFERENCE in phase between the
phase measured in the voltage measurement and the phase measured in the current measurement. To calculate and display the magnitude and phase of the pickup impedance, the following
simple procedure was used for Excel:
- from the Network Analyzer, for each of the two measurements, after the Bode scan is complete, disable the Cl 1 view (since it is not needed) and EXPORT the data to a .csv file, using GAIN (instead of db).
The exported file will contain frequency, gain (or amplitude relative to the C1 source voltage) and phase (relative to the C1 voltage source)
- import the first .csv file into Excel. The first few information lines can be either removed from the file or can be skipped in Excel
- import the second .csv file for the current measurments into Excel. Then copy the current measurements and phase from that file into the voltage measurement csv file as an additional 2 separate columns
- in an additional new column, create an Excel formula to calculate the impedance magnitude, for example as =B1*10000/D1 if the pickup voltage data is in column B and the pickup current
data is in column D. The 10000 is the value of Rs to convert the "current measurement" in column D from an actual measured voltage to current
- in another additional column, create an Excel formula to calculate the impedance phase angle as described above, for example as =C1 - E1 if the pickup voltage phase angle is in column C and the pickup current
phase angle is in column E
- create a separate scatter chart in Excel for each of the two new column results which are the complex impedance magnitude and phase
Results of this procedure are shown below:

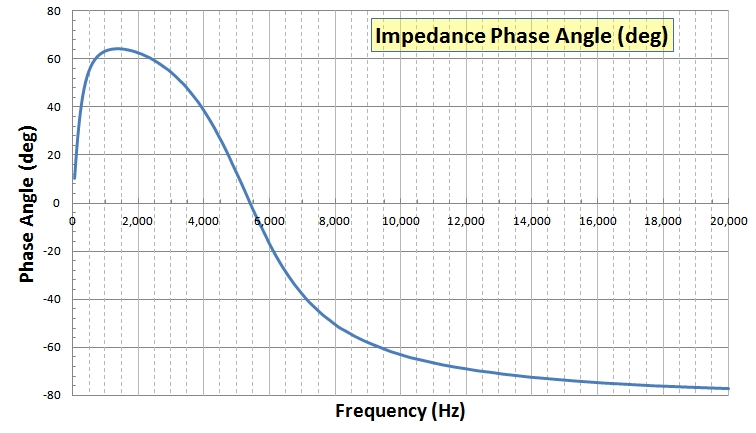
Impedance Results:
Examination of the plots above shows that:
- There is a strong resonant peak in impedance at 5.5 kHz
- The peak impedance magnitude is over 200 kΩ, typical of pickups. This is why electric guitars usually require high-impedance input amplifiers to prevent loading
- At the resonant peak, the phase angle is almost zero. At this point the current and voltage are in phase and the pickup looks "resistive"
- At frequencies lower than the resonant peak, the phase angle of the impedance is positive, meaning that the voltage leads the current (inductive-like)
- At frequencies higher than the resonant peak, the phase angle of the impedance is negative, meaning that the voltage lags the current (capacitive-like)
- At very low frequency, the phase angle again approaches zero as the impedance approaches the value of the pickup coil's DC resistance (8.5kΩ for this pickup)
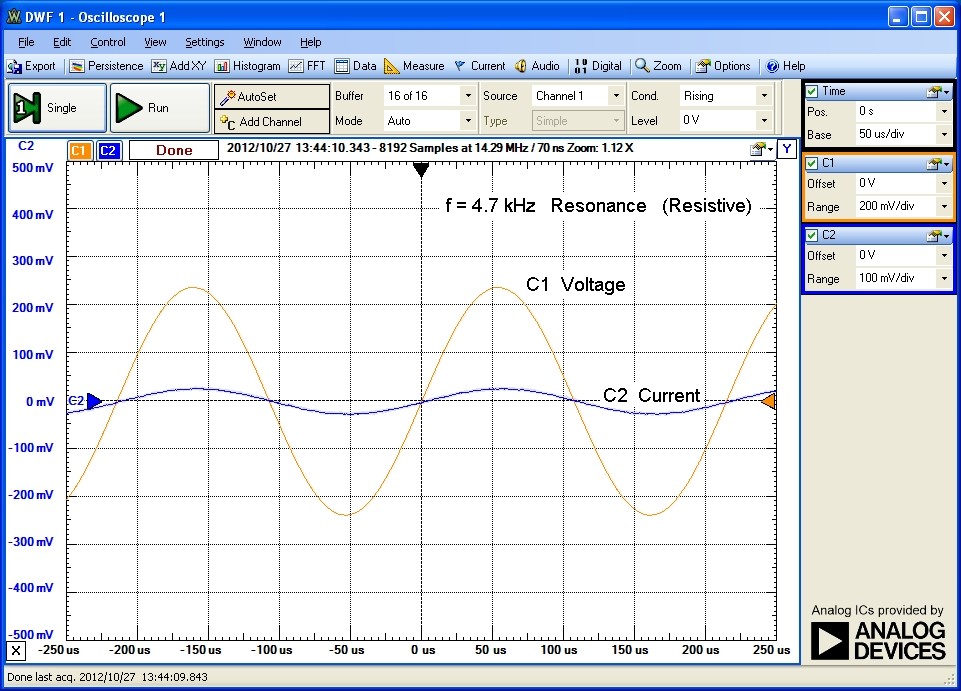
Phase Shifts:
The Discovery oscilloscope traces below for frequencies 1kHz, 4.7kHz and 10 kHz demonstrate how the phase angle of the pickup impedance changes from inductive-dominated at low frequency to capacitive-dominated
at high frequency:


Pickup Model Values:
Using the simplified model for the electric guitar pickup above, the component values in the equivalent circuit can be fitted to the measured results using either a simple
device simulator or by simple calculation.
The complex impedance, magnitude and phase for the simplified equivalent circuit are:


The resonant peak occurs at approximately:
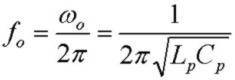
The pickup parameters are:
Lp = 4.2H Cp = 200pF
Rp = 8.5kΩ fo = 5.5kHz
Measurement Accuracy and Scope Loading:
It is important to understand the accuracy and limitations of a measurement. Note that the Discovery oscilloscope inputs have a 1MΩ input impedance
and 24pF shunt capacitance. This will modify the measurements somewhat particularly at frequencies near resonance where the pickup impedance is about 225kΩ.
This will shift the resonant peak slightly toward lower frequencies (due to the extra capacitance loading of the scope probes when across the pickup).
However because the Rs series "current-monitor" resistor is considerably smaller than the pickup impedance over most of the frequency range, the voltage amplitude measured
across the pickup will be very close to the applied voltage. By comparison, the voltage measurement across Rs to determine the pickup current changes considerably over
frequency. However the scope impedance and shunt capacitance for this connection are negligible in this frequency range compared with Rs=10kΩ. Also in the current measurement,
the scope probes are not loading the pickup itself. Therefore the measurement technique above will be accurate to about 10%. A more accurate analysis of the measurements would take into
account the scope impedance loading effect in the first measurement.
An alternate simple spot measurement for measuring impedance magnitude without scope loading across a high-impedance device is to measure the input W1 voltage with C1 and the (current-determining)
voltage across a smaller series resistor with C2 as above but using the Discovery oscilloscope and the Waveform Generator instead of the Network analyzer. Then an additional Math channel can be added in Discovery
and used to calculate and display the true vector voltage across the pickup using the Math function C1-C2 which is just Kirchoff's law for the series circuit.
Then set the Math window to display the Amplitude of this Math channel (i.e. the voltage amplitude across the load unloaded by the scope probes)
and Amplitudes of C1 and C2. Then as above the impedance magnitude at the Waveform Generator frequency is simply Amp(C1-C2)/Amp(C2)*Rs.