
EM Plane Wave Properties
Aug 08, 2017
Use EITHER the first row of input data: frequency, dielectric constant and conductivity, OR the
second row of input data: wavelength and complex refractive index n.

A plane electromagnetic wave propagating in a homogeneous, isotropic and linear medium, with possible loss, is characterized by transverse electric and magnetic field field vectors E and H. E and H are
mutually orthogonal and are both orthogonal to the direction of propagation. Taking the direction of propagation as z, and with E along the x direction, the plane wave field components
are Ex and Hy. The propagation constant k and plane wave intrinsic impedance Z (ratio of electric to magnetic field amplitudes), may both be complex in general and depend on frequency and the medium permittivity ε,
permeability μ and conductivity σ, all which are taken as real. κe and κm are the relative permittivity and permeability.
vp is the phase velocity and δ is the field attenuation distance.
Alternately, a complex refractive index n=nre + jnim can be used to describe media loss where k=k*n and nim<0.
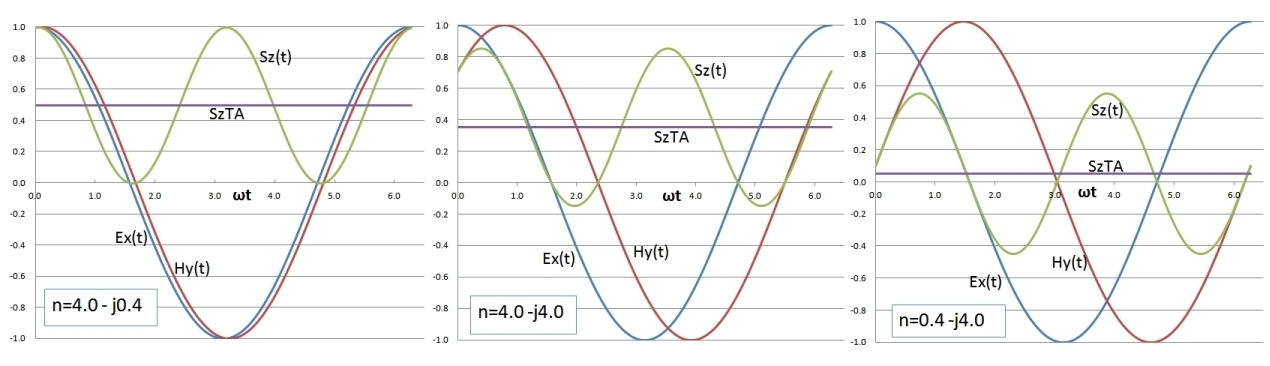
The charts below show the real values of Ex(z,t), Hy(z,t) (omitting the Re) and Sz(z,t) at a fixed value of z (different values of z simply shift the overall common phase of both fields and lowers the amplitudes at the same rate). It demonstrates the phase relationship between Ex(t) and Hy(t) for different values of relative loss and the instantaneous Poynting vector amplitude Sz(t) and its time averaged constant value SzTA.
The peak amplitute of Ex is taken as 1 and the value of Hy with relative phase determined by complex k or equivalently n (see expression above) is scaled in amplitude to provide easy comparison of the phase shift between Ex and Hy (described by the phase angle of Z).
The numerical values of Sz(t) and SzTA are computed from these Ex and scaled Hy values.
The leftmost charts are for a relatively low loss medium with a small phase angle (E leading H slightly). The middle charts corresponding to a medium with relatively high loss with equal real and imaginary
parts of the complex refractive index (and corresponding equal parts of the propogation constant k, similar to that of good conductors at frequencies well below optical frequencies). In this case Ex leads Hy by about
45 °. Note also that the instantaneous Poynting vector alternates in time between dominant forward and weaker reverse instantaneous power flow with the time-averaged value being positive, in the direction of phase propagation.
The rightmost charts are for a relatively high loss medium but with much larger imaginary part compared to real part of n corresponding to a large negative real part of the dielectric constant. In this case, the phase angle
between Ex and Hy approaches 90 °, the instantaneous Poynting vector surges strongly between forward and reverse directions and the time-averaged power flow approaches zero, but is still relatively weakly in the positive z direction:

The graph below shows the calculated EM plane wave properties over a frequency range of 1 Hz to 10 GHz for typical salt water (assuming the dielectric constant and permittivity are constant over this range).
The transition from good conductor (left part), where the phase velocity is much lower and the phase angle of Z is 45 °, to dielectric behaviour at the right where the phase velocity approaches c/9 and the attenuation approaches a fixed
and maximum value, is evident with the transition region occurring at about 1 GHz. Over this same entire frequency range, a typical metal like Cu would behave as a good conductor.

Reference:
- Electromagnetic Theory, J. Stratton, 1941, McGraw Hill, pp. 273-278