
The WaveLab Bit Meter
The WaveLab Bit Meter monitor
has many uses as described in the documentation. This article describes how to interpret the Bit Meter display during playback using the True
and Intuitive modes using two simple demonstration wave files and shows how the Bit Meter display relates to the wave Loudness Envelope results. If the Master
Section is set at the default 0dB level position with no effects or dithering added, the Bit Meter should display the native bit information of the wave file itself.
The wave files
For the tests here, two 10 second 24 bit/96 kHz wave files were synthesized. The first wave file is a stereo
"DC" PCM file with all samples having identical values corresponding to the 3rd highest bit being set (this is bit 3 in the Bit Meter display). The sample
data value is therefore:
001000000000000000000000 or 0x200000 or decimal 2097152
The second wave file is a 1 kHz synthesized SINE wave with peak amplitude corresponding again to the 3rd highest bit. Actually the peak amplitude that was used
is 2085000, just slightly less than the peak value but all bits up to and including the 3rd bit will be active during the sine wave. In the displays below, only one
channel is shown.
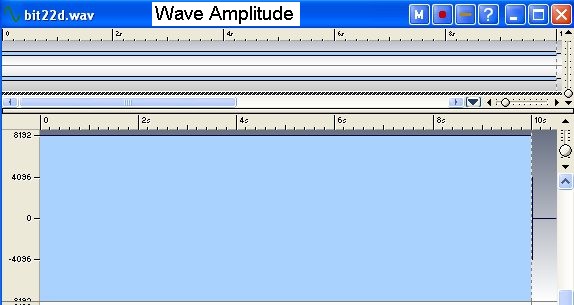
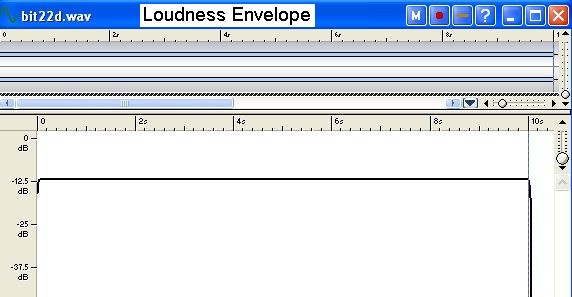
1 kHz Sine Wave Results
The wave amplitude and loudness envelope displays are shown first. (WaveLab6 always displays the amplitude as a 16 bit-range value).
The loudness envelope shows a constant value of -12 dB as expected for a SINE wave
with peak amplitude at about bit 3:
20*log_10(2085000/8388607)
The Bit Meter display in True mode shows all 24 bits in use because 24 bit integer PCM data uses 2's complement format and since the sine wave cycles through very small
negative values this will cause all bits in the 3 byte samples to be used.

Next, the Bit Meter display in Intuitive mode shows the magnitude bit display with all bits up to and including bit 3 in use as expected:

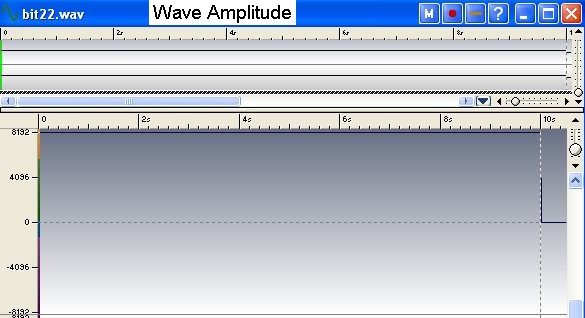
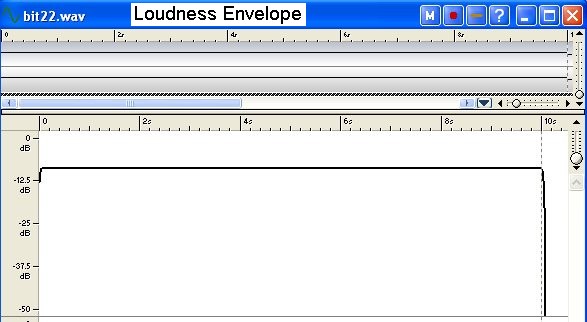
DC Wave Results
The wave amplitude and loudness envelope displays are shown below for the "DC" constant sample wave file.
The loudness envelope now shows a constant value of -9 dB, or 3 dB higher than the sine wave with the same peak amplitude.
This is expected since the the loudness display is in dB units relative to 0 dB corresponding to a full scale sine wave. A sine wave
has an RMS amplitude value Sqrt(2) lower than a DC level at the peak value and so the power for the DC sample wave is twice as high or 3 dB greater then the SINE:
Now, the Bit Meter display in True mode shows only bit 3 being used as expected since the amplitude value is constant and positive.

The Bit Meter display in Intuitive mode shows bits 3 and 2 corresponding the the 3 dB higher value of the DC level. The lowest bits don't display as they
are not actually used:
