E-Field Contour Plots: Interface Reflection
Oct 19, 2014
The contour plots below show electric field patterns for a plane wave incident from the upper left of medium N1(upper) into medium N2 (lower) for various angles of incidence.
The plots are for the S polarization (TE) for an incident E field amplitude of 1.0 in the transverse y direction (normal to displayed plane). The first 4 plots are for N1< N2. The third
plot shows the field pattern for a 3 region N1, N2(single layer), N3 antireflection coating. The final plots are for N1> N2.
The field amplitude reflection and transmission coefficients rs and ts are shown.
These values are complex if the media are absorbing, or if there is total-internal-reflection (last plot).
The net incident E field and refracted field amplitudes were determined by
using the Fresnel interface reflectivity expressions, and then summing the complex travelling wave fields in the incident medium and taking the real part.
Computation for 250x250 points was performed and the data matrix was imported to Excel for contour plotting.
The plots represent the 2 dimensional amplitude (not intensity) pattern of Ey at a specific instance of time in the xz plane of incidence in a square region
several vacuum wavelengths in size. Advancing the time simply shows the pattern
fluctuating in amplitude for the 2 dimensional optical "standing wave" field interference distribution in N1 and the refracted wave moving toward the lower right.
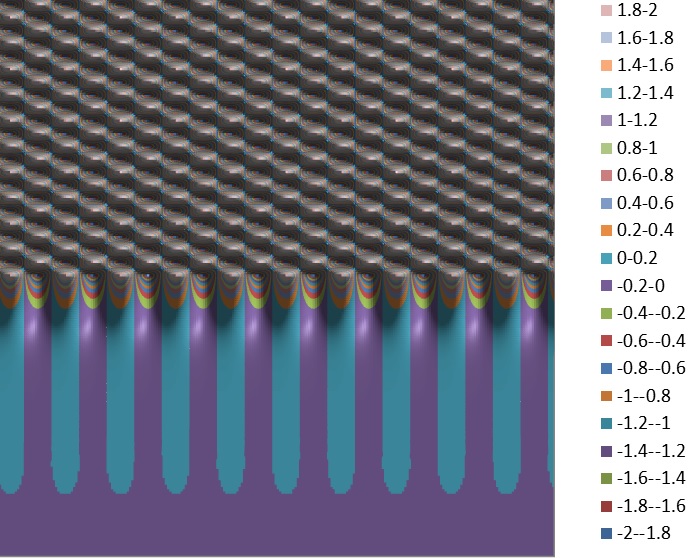
The pseudo-color scale shows the values of the net reflected field in medium N1 and the refracted field in medium N2. These plots help to visualize interface
tangential field continuity, refractive effects and the spatial interference patterns between incident and reflected waves as well as total internal reflection effects. Of interest also is the
field distribution for glancing angles of incidence approaching 90°
N1=1.0 N2=1.1 θ = 45° rs=-0.0874 ts=0.9126

N1=1.0 N2=3.0 θ =45 ° rs=-0.6096 ts=0.3904
N1=1.0 N2=1.60 N3=3.0 θ =45 °
rs=0.0013 < 73.6° ts=0.4925 < -89.9°
t2=0.16μm λ=1.0μm AR Coating
N1=1.0 N2=3.0 θ =89.9 ° rs=-0.9988 ts=0.0012
Glancing Incidence

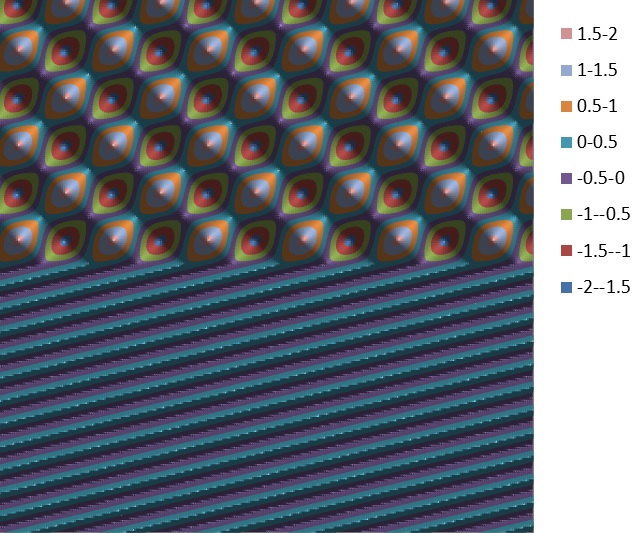
N1=3.0 N2=1.0 θ =15 ° rs=0.6428 ts=1.6428

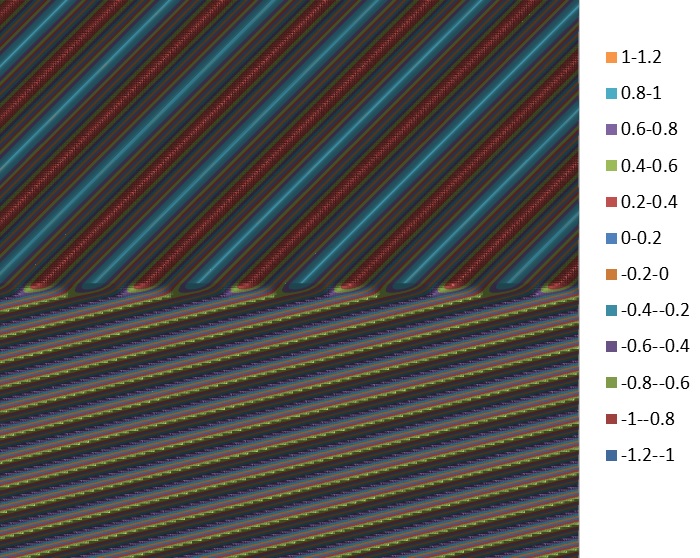
N1=3.0 N2=1.0 θ =25 ° rs=1.0000 < 31.9905° ts=1.9226 < 15.9952°
TIR